Logistic Regression
In Previous topic we came across the first most machine learning algorithm which is Linear Regression. Now it’s learn about one of the linear algorithm in this section.
What is Logistic Regression?
Logistic Regression is used to solve the classification problems, so it’s called as Classification Algorithm that models the probability of output class.
- It is a classification problem where your target element is categorical
- Unlike in Linear Regression, in Logistic regression the output required is represented in discrete values like binary 0 and
- It estimates relationship between a dependent variable (target) and one or more independent variable (predictors) where dependent variable is categorical/nominal.
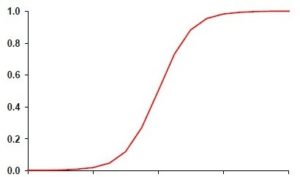
Sigmoid Function:
- It is the logistic expression especially used in Logistic Regression.
- The sigmoid function converts any line into a curve which has discrete values like binary 0 and.
- In this session let’s see how a continuous linear regression can be manipulated and converted into Classifies Logistic.
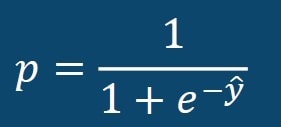
Where,
P represents Probability of Output class Y represents predicted output
Learning Logistic Regression Model:
Consider a scenario where we need to classify whether a patient has diabetes or not. If we use linear regression for this problem, there is a need for setting up a threshold based on which classification can be done. Say if the actual class is malignant, predicted continuous value 0.3 and the threshold value is 0.6, the data point will be classified as not malignant which can lead to serious consequence in real time.
From this example, it can be inferred that linear regression is not suitable for classification problem. Linear regression is unbounded, and this brings logistic regression into picture. Their value strictly ranges from 0 to 1.
Comparing Linear Probability Model and Logistic Regression Model:
As Linear Regression is unbounded, it’s not useful to solve classification problems. So this is where Logistic Regression comes into picture.
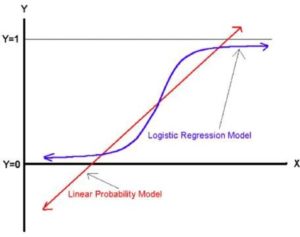
We know that the below expression is the Linear equation used in Linear Regression.
![]()
x is the independent variable
Now let’s see when what happens when we related both the algorithm equations.
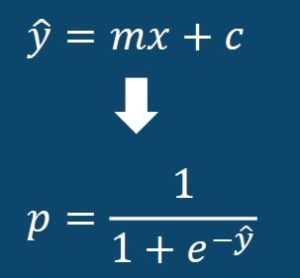
When we substitute the linear equation ?□ in the probability equation we get the below result.
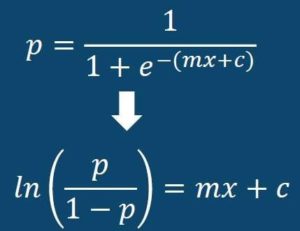
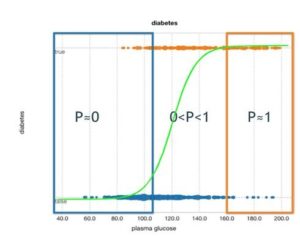
From the above equation we can see that the value of P lies in between 0 and 1. So the graphical representation of the same will be as below.
Types of Logistic Regression:
- Binary Logistic Regression
- Multinomial Logistic Regression
- Ordinal Logistic Regression
For the model to be a cent percent accurate one, we need to calculate and find out few parameters of the algorithm in order to check how accurate our Binary Logistic Regression model is.
The key parameters we calculate and check are dependent of the topic called CONFUSION MATRIX.
What is the Confusion Matrix?
The confusion matrix is a type of table used to define the characteristics of Classification problems.
| Negative(0) | Positive1(1) | |
| Negative(0) | True Negative | False Positive |
| Positive(1) | False Negative | True Positive |
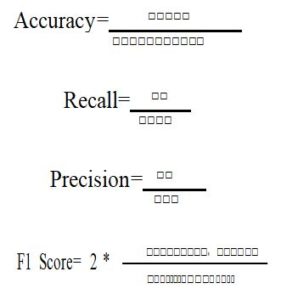
The below are few expressions calculated in order to find how accurate the prediction of the model is.
- Accuracy
- Recall
- Precision
- F1 score
Let’s see the mathematical formulae for these parameters.


