Tableau Tutorial
Our Tableau tutorial introduces the reader informally to the basic concepts and features of the Tableau. We hope these Tableau Tutorials are useful and will help you to get the best job in the industry. These Tableau Tutorials are prepared by Tableau Professionals based on MNC Companies’ expectations. Stay tuned we will update New Tableau Tutorials Frequently. If you want to learn Practical Tableau Training then please go through this Tableau Training in Chennai, Tableau Training in Bangalore, and Tableau Training in Pune.

Introduction of Tableau Tutorial
Besant Technologies supports the students by providing Tableau Tutorials for job placements and job purposes. Tableau is the leading important course in the present situation because of more job openings and the high salary pay.
These Tableau tutorials are suitable for both freshers and experienced professionals at any level. These tutorials are for intermediate to somewhat advanced Tableau professionals, but even if you are just a beginner or fresher you should be able to understand the tutorials by examples and explanations here we give.
Data has become the most important asset of many organizations, this has made huge demand for the data visualization tools and for the professionals who can handle these tools. If you are in search of Tableau tutorial you have come to the right place. We will come across all the basic to advanced concepts in this tableau tutorial for beginners and experienced. In this tableau tutorial, we are going to cover all the fundamental topics to make you knowledgeable on all fundamental concepts of a tableau.
What is Data visualization?
Data visualization plays an important role in today’s modern world and helps organizations in leveraging benefits hidden in the raw data. In simple terms, data visualization is the process to represent the data in a graphical format for clear understanding purposes. The huge sets of data are very complex to understand so, to easily this process, data can be plotted onto different graphic formats such as charts, maps, tables, infographics, etc. Data visualization helps you understanding and simplifying data and also helps you in detecting patterns, trends, and insights out of data.
Data visualization gives you a complete glance over market conditions and customer needs. This could help an organization to develop plans and smart strategies to meet the customer requirements, and enhance business growth. This reason has motivated all the data science companies to build and enhance their data visualization capabilities to bring out the value out of massive sets of data.
Let’s discuss top data visualization tools here
Below mentioned are the top 5 business intelligence tools that are being used extensively for visualizing data.
- Tableau
- Qlikview
- Domo
- Microsoft Power BI
- Qlik sense
Let’s have a glance over each of them
Tableau:
Tableau is the most popular and powerful business intelligence tool used by organizations. The unique features and continuous developments in tableau tool have acquired its huge popularity. It simplifies raw data into an easily understandable format with advanced dashboards and data integration features. Tableau help it’s users to analyze the data by providing them deeper insights with compelling dashboards and worksheets.
Qlikview:
Qlikview is the widely deployed business intelligence because of its nature of flexibility in turning data into knowledge. Qlikview allows the easily consolidate, search, and visually examine their data for gaining special insights. Its dynamic model allows users to analyze data in multiple dimensions. Qlik Sense can easily be integrated with a wide range of data sources such as Oracle, SAP, Salesforce, Excel spreadsheets, etc.
Domo:
Domo is a cloud business management suite available for all users irrespective of the user’s technical expertise. It creates seamless integration with multiple data sources including databases, spreadsheets, social media and from any other cloud solution. Domo offers a Centralized dashboard in which you can access to company-wide data to have a clear glance.
Microsoft Power BI:
Power Bi is a business analytics service offered by Microsoft. It is a cloud-based business intelligence tool & provides a full overview of your critical data. It can be easily connected to all your data sources for evaluation and you can easily share dashboards make interactive reports and a lot more.
Qlik Sense:
Qlik sense sets the benchmark for the new generation of data visualization. Its advanced features like analytics engine, sophisticated AI, and scalable multi-cloud architecture allow everyone in your organization to make data-driven decisions in a fast way which improves business growth and performance.
Now let’s get into the main part of the Tableau Tutorial.
Why Tableau is so Popular?
Tableau has been gaining popularity since the day it was launched due to its potentiality and efficiency. It has got second place in the Gartner magic quadrant for analytics and business intelligence tools 2019.
There are many factors in tableau which have acquired huge popularity, some of them include drag and drop functionality, high scalability, speed, adaptability, data connectivity from multiple sources, online version, big data analytics capabilities, no need of connector license, etc. Irrespective of designation or department anyone can perform data analysis and visualize data in a simplified way.
Must Read: What is Tableau
Tableau Features:
Effective visualization:
The capability of Tableau in connecting to various data sources helps it in visualizing larger data than any visualization tool. A user can visualize the data ranging from basic to complex data sets. One can apply various visualizations to data according to their requirements. In the tableau, you can easily switch between the visualizations. You can actually make your visualizations more effective and detailed using color, size, shapes, and labels, which enables you to explore at the granular level.
In-Depth Discovery:
The features of Tableau lets you drill down to the depths of data for finding answers to your questions and allows you to make comparisons between various data components to validate your decision.
Tableau Deployment:
Tableau comes with multiple implementations and consulting services. To implement in enterprise-level deployments it takes four-step process spanning weeks, and for small scale deployments, it takes only a few hours to set up with its quick start option.
Enterprise-level deployment can be completed with the below four-step process.
Step1: This step involves things like Architecture consulting, IT Planning, Pre-install check-up, installation of server checkup, and security configuration.
Step2: This Phase is associated with the data things related elements such as data migration, modeling, mining, extraction, data sources, and business flow.
Step 3: This phase associated with classroom training for providing awareness of fundamentals, building, formatting visualizations, etc.
Step 4: This is the final stage in which companies are now can use tableau across their business for gaining business insights.
Automation Functionality:
Tableau is more advanced in terms of calculations and creating process. For instance: when you want to create a calculation in tabular format, you need to type formula only once, it gets stored as a field and applies to all rows referencing that source. It suits better for the recurrence process. Tableau facilitates customizing formulas and this feature is not available in most other data visualization tools.
Data source Connectors:
Tableau offers a wide range of native connectors that are very helpful in sourcing data from any source without writing any custom code. Tableau has two powerful methods to extract data from large data sets. The two methods are In-memory and Live Connection. These both methods would allow you to connect the data sources from your local database and, based on the size and capacity, sync data instantly by extracting the right data for relevant data to query. It also comes with a special feature which is an Open Database Connectivity (ODBC) connection for the database that doesn’t have a native connector provider.
Ask Data:
This is a new and unique feature of Tableau, in which a user allowed to type any query and the system will give the appropriate result instantly. Ask data also very helpful in data sorting, aggregation, and filtering.
Tableau Prep Conductor:
It is an add-on feature for Tableau Online and Tableau Server. Tableau’s conductor helps in delivering the prepared data in a secure and reliable server environment.
Tableau Products
Tableau Desktop:
It is a self-service data visualization and business analytics platform that can be used by anyone. It enables you to connect directly with the data warehouse for live up to date analysis and also one can perform queries without coding. Tableau specialized in translating the pictures into optimized queries. You can import all your data into Tableau’s data engine from various databases and integrate them for creating multi-view, interactive dashboard.
Tableau Server:
Tableau Server is an enterprise-level software. It hold all your Tableau workbooks and data sources. Using tableau software you can build and publish dashboards with Tableau share them in an organization using a web-based Tableau server. It allows organizations to leverage real-time data analytics.
Tableau Online:
Tableau Online is also one of the important products from the Tableau and hosted in the cloud. This is a hosted version of tableau and makes this BI tool faster than ever before. You can share the dashboards and discoveries with colleagues or customers. Tableau online can easily accessible from web-browser or on the go with our mobile app.
Tableau Reader:
Tableau reader is a free desktop application from Tableau. It is required to read and communicate with Packaged Workbook. It allows you to filter or drill down data but you are not allowed to make any interactions or edits.
Tableau Public:
This is free software from tableau using which one can create, interactive graphs, live dashboards, and stunning maps. You can save your files in your public profile, and share it on the web. The workbook or worksheets in the Tableau Server you have saved can be viewed by anyone.
Tableau Mobile:
Tableau mobile is built for extending tableau on devices such as tablets and mobile phones. This feature is highly scalable and adjustable according to the screen size. You can interact with the dashboards and workbooks created on tableau desktop, public, and share through Tableau Online and Tableau Server. Tableau Mobile comes with features such as designing, security, dashboards searching, sharing and alerts capabilities.
Tableau Architecture

Behind any effective tools, there is a well-designed architecture framework and services. Tableau architecture is the main component of all great visualizations in tableau. Tableau has a highly scalable client-server Architecture that is suitable for web clients, mobile clients, and desktop installed the software. Tableau is a Multi-tiered, multi-thread, multi-process and multi-user architecture that can support both physical and virtual environments.
Tableau architecture is designed in such a way to easily manage the data between various data sources and clients. The best part of the tableau is its server which hosts different services working in tandem.
Click Here -> To Know About 5 Laws that will help the Tableau Industry
Advantages of Tableau
Let’s discuss all the advantages that we gain from using tableau
Deployment
It is very important to check whether a BI tool can be deployable on all platforms or not. But when it comes to tableau one can easily deploy in different platforms such as on-cloud or on-premises. It supports the operating systems like Linux, Mac, and Windows as well as supports multi-tenant deployments.
Collaboration
Data collaboration is very simple in Tableau because it allows integration of data from different sources. using Tableau you can get the data from Excel workbook, a PDF file a database like Microsoft Azure database, Microsoft SQL Server, and from the data warehouses like oracle or Big data. You can also perform live data analysis by connecting to live data sources.
Quickly Create Interactive visualizations:
Tableau is a highly customizable data visualization tool and comes with drag and drop functionality which enables you to create interactive dashboards within minutes. Tableau interface comes with the capability to handle endless variations and also limits you from creating charts that do not meet visualization best practices.
Easy to use
The advanced features of the Tableau made it as best data visualizations tool with enhanced user experience. Tableau is very easy to learn compared to Python, Domo, and Business Objects and coding is not required to learn Tableau.
Use of other Scripting languages in Tableau
To provide faster performance and to avoid issues arises in table calculations in tableau users can incorporate R or Python. Python would help the Tables in minimizing the load for the software by cleansing data with packages. Python is not a native scripting language for the Tableau. So you need to import the packages or visuals.
All device Support and responsive dashboard
Tableau comes with the advanced dashboard features to support all devices such as Mobiles, tablets, and laptops. Tableau automatically understands the user device, make adjustments and serve the right report to the right user.
Governance
Tableau is highly concerned about security provisions of data, every new version of tableau comes with the improved version of security concerns. In Tableau data managed in a centralized way, along with this, certifications, licenses, analytics performance, row-level permissions, made Tableau environment secured.
Data prep
This feature of tableau enables the Tableau to prepare data for analysis purposes by manipulating the data based on user requirements. Smart grouping algorithms enable users in organizing data. This process made easier with Tableau’s user interface. You can even use the prepared data in workbooks and dashboards.
Tableau Applications
Below mentioned are the industries where Tableau can be fit into:
- Government sector
- Healthcare analytics
- Education analytics
- Marketing analytics
- Insurance analytics
- Loan risk analysis
- High technology analytics
- Energy and resources
- Retail and consumer goods
- Manufacturing
- Financial services
- Public sector
What are the companies using Tableau?
Below mentioned is the list of companies who are using Tableau:
- Walmart
- Scientific Games Corporation
- Amazon
- Adobe
- TripAdvisor Inc.
- Deloitte
- UdbudsVagten
- CoStar Group Inc.
- Cisko
- Seagate
- GoDaddy
- Citrix
- Tesla
- Bookimed
- JPMorgan
- Lufthansa
- Coca-Cola
- Lenovo
- Pepsico
Future Scope of Tableau
Data Visualization is gaining huge popularity over the years due to increased dependency on data. Companies are now days purely relying on data delivered from various devices and this data has been increasing over the years. This has motivated organizations to opt for data visualization to make data-driven decisions. Tableau named as a top-ranked visualization tool for many years in the Gartner report. Consistent developments in Tableau features and functionalities helped it in placing itself ahead of its competitors. The people who learn tableau have a huge job opportunities and companies are offering good salary packages to the Tableau professionals.
What are the different job roles available in Tableau?
Tableau offers a variety of job roles at different levels. The following are the available job titles for the Tableau professionals.
- Tableau Consultant
- Business Analyst
- Data Analyst
- Business Intelligence Developer
- Business Intelligence Analyst
- Business Intelligence Manager
How to Download & Install Tableau Public (Free) & Desktop (Trial)
Let’s discuss about Tableau Public First.
Below mentioned are the steps to follow download Tableau Public:
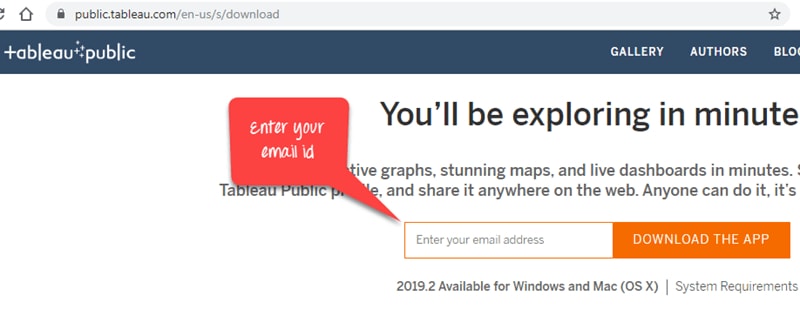
Step 1: Search https://public.tableau.com/en-us/s/download on your browser. Now enter your email id in the specified box and click on the “DOWNLOAD APP” icon.
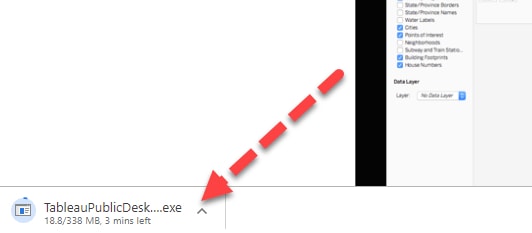
Step 2: It will start downloading you the .exe file in your windows machine by default. You can see the file downloading process on the down left corner of your screen.
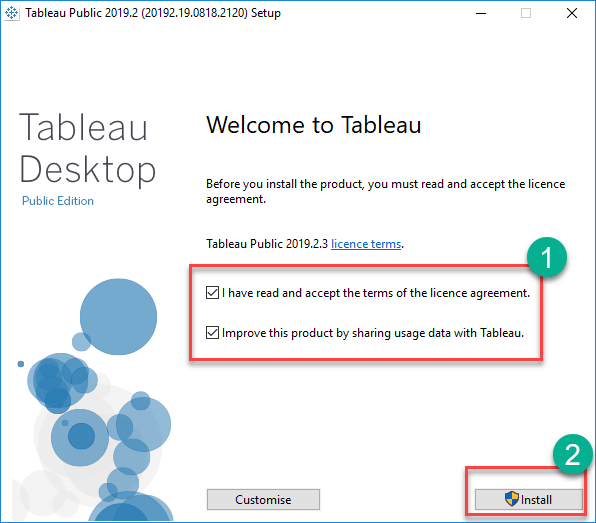
Step 3: Now open the file once it gets downloaded. Accept terms and conditions then click on installation button.
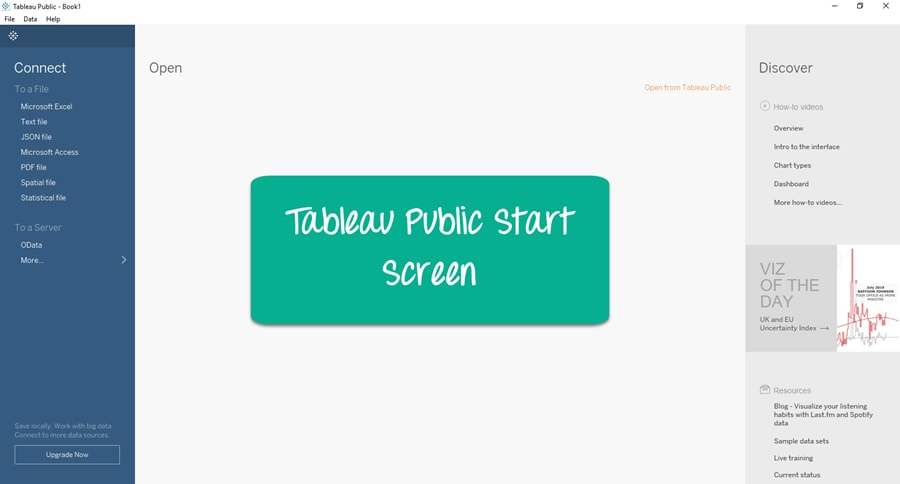
Step 4: once you are done with installation process you will be displayed with a screen like below. Now you can start using it.
Steps to follow to Download and Install Tableau Desktop
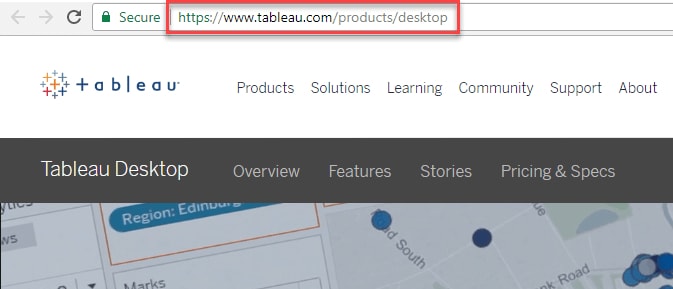
Step 1: Open your browser and go to https://www.tableau.com/products/desktop.
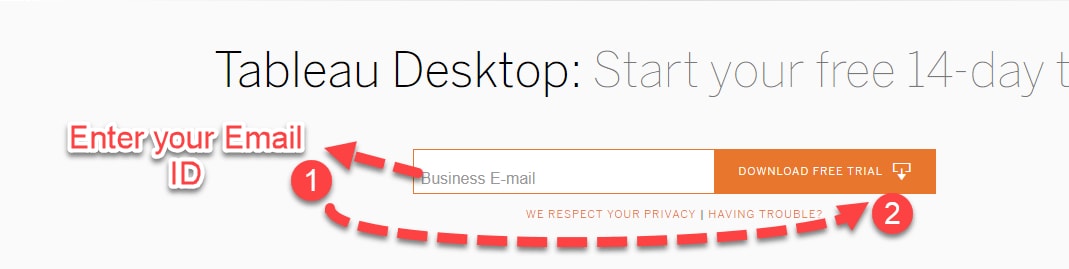
Step 2: Now you will be taken to a screen where you can see three options which are Pricing, Sign in, and TRY NOW. Click on Try now”.

Step 3: Now you will be taken to the page where you are required to enter your Email address and hit the “FREE TRIAL” button.
Step 4: Now it will start downloading the latest version of Tableau Desktop .exe file at the left corner of your screen.

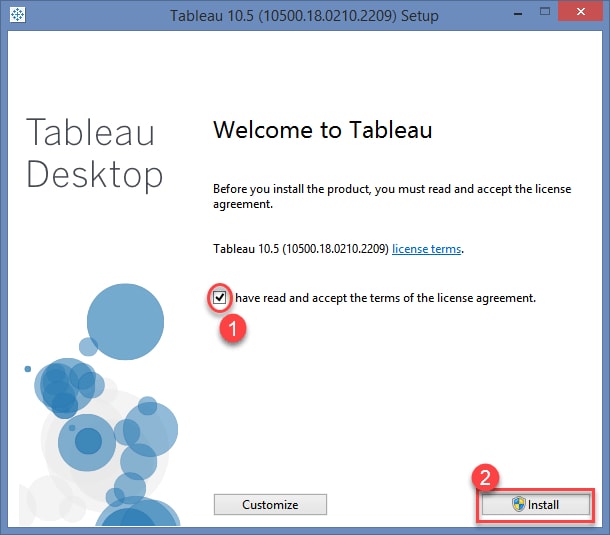
Step 5: Open the downloaded file. Accept the required terms and conditions and hit the “Install” button.
Step 6: you will be shown with the optional pop-up message to get the approval from the administrator to install the software. Click on “Yes” it gets approved. It will start the installation process on your Windows. Once you are done with the installation process, open the Tableau Desktop Software.
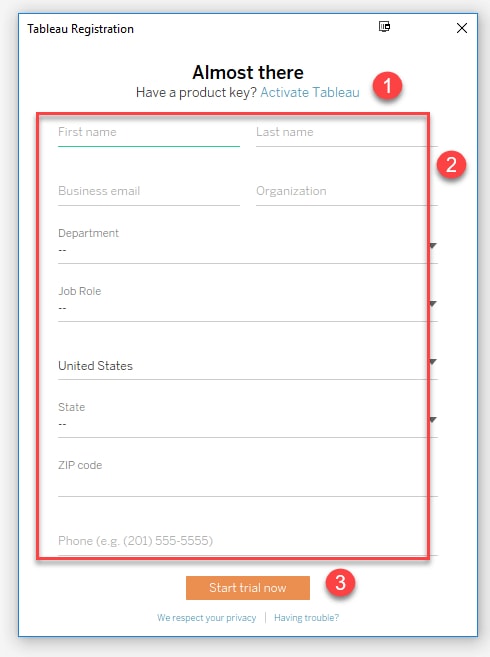
Step 7: In this step you will see a registration window, you need to click on Activate,
- Enter Your Credentials
- Click on Start Trial Now.
Step 8: wait till the registration process completes.

Step 9: you will get a screen like below
Now you are all set to use your Tableau in your windows machine.
Introduction to Tableau Table Calculation
Tableau table calculation is a calculated field based on the data in the report table. It have the several type of calculations like total, percentage, average, etc., In this article we will see how to create the calculated field in the tableau and how we can utilize all the properties.
Benefits:-
- By doing the mathematical calculation like sum, total, average, percentage etc., is makes much easier in the table
- We could also save the calculated fields in tableau
- The result values will be more efficient
Before we get into this demonstration, we need to be know how to connect the data connection and will take one bank customer dataset to do this analysis.
Let’s begin with the demonstration, start your tableau desktop and download the given dataset.
- If you are new and have trouble to install the tableau desktop, please use the link to follow the steps and procedures Click here
- Download the dataset: Click here
Now open the tableau desktop which is installed in your machine and connect the excel file using the data connection “Microsoft Excel”

Once you connected the dataset and the data will be looks like below picture

Now go to the sheet1 and create a report based on customer name and their balance details

There is an option which will allow us to do the Quick Table Calculation. It will run the various calculations based on the table view and it would be like below

Once ran the total calculation and the output will be shown below picture

The calculation methods falls in two method and it will be rely on the same
- Addressing field
It will do the same direction calculation
- Partitioning field
It will partition the table report and then do the calculation
In the given example we did the calculation based on addressing field name of the customer, it from top to bottom calculation. By adding more number of column to compute the calculation in different methods. After added few columns and the output will be shown below

Here we would also partition the calculation based on our needs.
We could do an analysis using the table calculated field and it can be saved in the respective sheets. Click the analysis tab and create a calculated field in the table.

Difference between Tableau Table Calculation and Tableau Calculated Fields
Both are being using for calculation and compute the result. However there is some difference between each of these.
| Table Calculation | Tableau calculated field |
| It will create locally in the specific sheet or the table view | It will create a new column and make a calculation from the data source |
| By default it can’t be reused anywhere, because it is creating locally | The calculated field can be used anywhere in the workbook |
| There is alternative method to save the calculation in the pane to reuse in another sheets | It will be computed within the data source and can be call from any workbook |
From the comparison of both we could understand the calculated field can be used for deeper analysis because table calculation have some limitations.
Tableau calculation functions
Let’s see some of the calculation functions using in tableau
Lookup
- So we all know that lookup is nothing but to retrieve the relative values of the given expression and targeted column
- Syntax : LOOKUP(expression,[offset])
Index
- Index will return the value from the given range when the expected condition meets.
- Syntax : Index() = 5
First
- It will display the given no. of rows from top
- Syntax : First() = 7
Last
- It will display the given no. of rows from bottom
- Syntax : Last() = 8
Previous value
- It will return the previous value based on the calculation.
- Syntax : SUM([BALANCE]) * PREVIOUS_VALUE(5)
Rank
- It will return the rank of the row based on the calculated value
Running Max
- It will return the maximum value in the given calculated column in the partition
- Syntax : RUNNING_MAX (SUM[BALANCE])
Running Min
- It will return the minimum value in the given calculated column in the partition
- Syntax : RUNNING_MIN (SUM[BALANCE]
Running Avg
- It will return the average value in the given calculated column in the partition
- Syntax : RUNNING_AVG (SUM[BALANCE])
Running count
- It will return the total number of count in the given row or column in the partition
- Syntax : RUNNING_COUNT (SUM[BALANCE])
Running sum
- It will return the total of selected column or row in the partition
- Syntax : RUNNING_SUM (SUM[BALANCE])
Size
- It will returns the how many rows present in the given partition
- Syntax : SIZE = 8
Total
- It will run the sum value of entire table column or row
By understanding in this article, we have learnt about the tableau table calculation method, how to use in tableau desktop and some calculation functions.
Conclusion
With this we have come to the end of this Tableau tutorial, hope you have enjoyed reading this Tableau tutorial. If you are aspiring to become Tableau professional it is advisable to take training from the best tableau training providers, Checkout our tableau training course designed by industry experts here. If you have any doubts please comment them in the comment section, we will address them at the earliest. Happy learning!