What is Matplotlip
Matplotlib is one of the famous Python packages; it is for data visualization. One of the popular use of python is for data analysis; matplotlib.pyplot is a python package, which is used for 2D graphics.
To use matplotlib.pyplot we should first install matplotlib. Open a command prompt and type pip install matplotlib and press enter. If the package is not present, it will automatically download the matplotlib package and all its dependency packages from the internet. If matplotlib is already present, it will show the requirement already satisfied. Suppose, if you want to upgrade matplotlib, open a command prompt and type pip install -upgrade matplotlib the latest version of matplotlib will be downloaded.
Dependencies
There are many dependencies of matplotlib,
- Python Version > 2.7
- setuptools
- numpy version >= 1.11
- dateutil version >= 2.1
- pyparsing
- kiwisolver version >= 1.0.0
- FreeType version >= 2.3
- libpng version >= 1.2
- Cycler >= 0.10.0
In addition, you can install number of other packages for better user interface toolkits.
- Tk
- PyQt4 version >= 4.6
- Pyside version >= 1.0.3
- PyQt5 version
- PyGObject
- wxpython >= 4
- cairocffi >= 0.8
- Pycairo
- Tornado
Why Matplotlib?
As we have seen above, matplotlib is widely used in data analysis. Data Scientists usually work with large data sets and they want a way to visualize their data for better understanding and to gain more insights about the data
Even a person with no knowledge of the data set can understand by just seeing the visuals. An image can represent 1000 unspoken words.
How to Import Matplotlib?
The package can be imported by import matplotlib.pyplot as plt. Here we have imported the package and we have given an alias name to it as plt. Therefore, if we want to call matplotlib.pyplot, it is enough to use only plt.
Once you have successfully installed the package, then you are ready to proceed further to visualize your data.
Types of Plots
In this topic, we are going to discuss widely used plots. The most widely used plots are,
- Line Plot
- Bar Chart
- Scatter Plot
Line Plot
It is widely used across various industries like biology, sports, finance, and many more. It is used mostly used on continuous data, to see increasing or decreasing trend, patterns etc.,
plt.plot() function is used to plot line plot
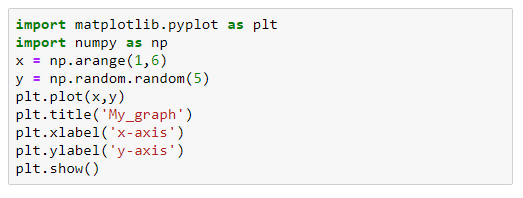
First, we have to import the required packages. Here, I have imported matplotlib and numpy. Matplotlib is for visualization and numpy is for value generation.
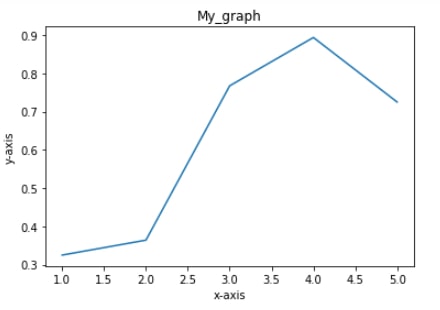
After importing the packages and assigning values to variables, we want to plot the data. Usually, a normal line plot required two inputs, here we have created x and y which can passed as inputs. Finally, we have use show() to display the plot. If the above code is executed, the output will be as follows,
- Plt.plot -> used for plotting the data
- Plt.title -> used for assigning title
- Plt.xlabel -> used for assigning name to x-axis
- Plt.ylabel -> used for assigning name to y-axis
- Plt.show -> used to display the plot
Bar Chart
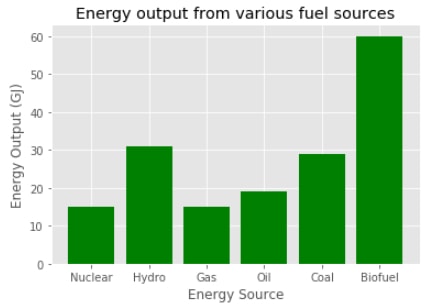
Bar charts are used to displays values, which are categorical with rectangular bars with lengths or heights. The bars can be either vertically plotted or horizontally plotted. It is used for comparison purposes. plt.bar() function is used to plot bar plot
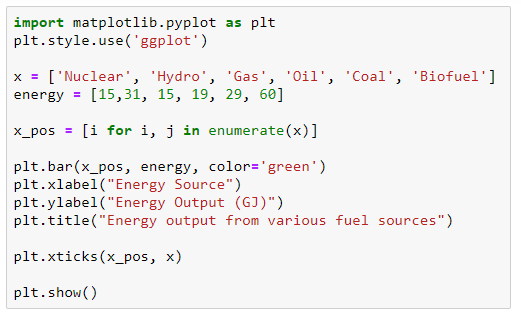
I have created two variable x, energy and assigned values to it. Then, I am looping the value of x using enumerate and storing it in x_pos.
- Plt.bar -> used to plot bar chart
- Plt.xlabel -> used for assigning name to x-axis
- Plt.ylabel -> used for assigning name to y-axis
- Plt.title -> used for assigning title
- Plt.show -> used to display the plot
Scatter Plot
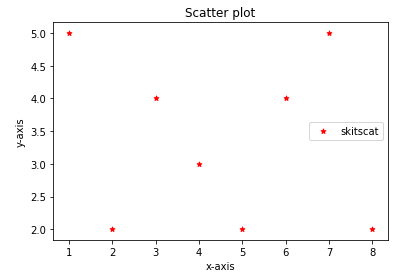
Scatter plots are used to plot data’s on horizontal axis and vertical axis, to show how one variable is affected by another variable

- Plt.scatter -> used to plot scatter plot
- Plt.xlabel -> used for assigning name to x-axis
- Plt.ylabel -> used for assigning name to y-axis
- Plt.title -> used for assigning title
- Plt.show -> used to display the plot
